Plot Diagram for Young Writers: Map an Adventure Before Generating a Story
A plot diagram maps a story’s shape in five parts: exposition, rising action, climax, falling action and resolution. Most classes use it to analyse books they have read. This grades 4–8 lesson uses it to plan an original adventure instead. Students fill the five stops before writing or generating anything, then check the finished story against the map.
By ArtifyTales Team, Nell AI Labs LLC · Published · 6 min read
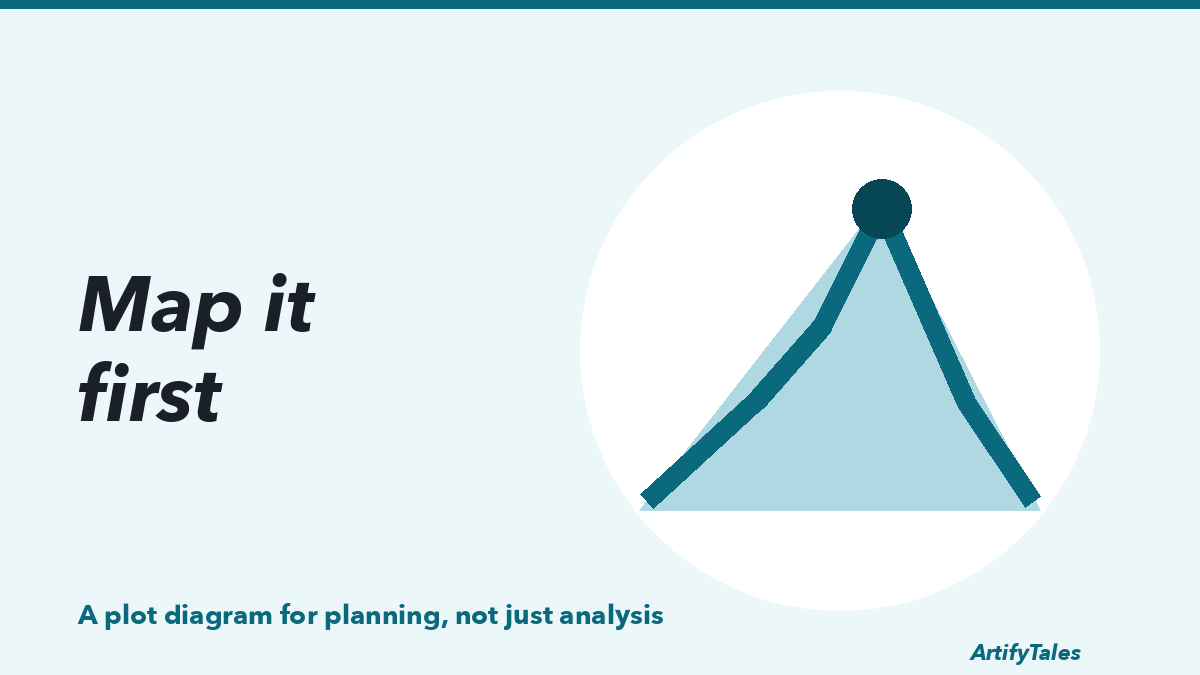
Most students meet the plot diagram as a reading exercise. They read a story, then fill in the mountain: exposition here, climax at the top, resolution at the bottom. It is useful for analysis. It is even more useful for writing, and that is how most classes never use it.
This lesson turns the plot diagram into a planning tool. Students map an original adventure on the mountain before they write a sentence, or before they ask any story tool to draft one. Then they check the finished story against the map. The diagram stops being a worksheet and becomes a plan they can test.
| What a teacher needs | This activity |
|---|---|
| Grades | 4–8 |
| Time | Two sessions of 45 minutes: map, then write and check |
| Prep | A blank plot diagram with five labelled stops |
| Student output | A completed plot diagram, a short story, and a map check |
| Assessment | Rising tension, a real climax, and a resolution that shows change |
The five stops on the plot diagram
Give students the question for each stop rather than just the label. "Exposition" means little to a ten-year-old. "What does your character want?" is something they can answer.
- Exposition: Who is the character, where are they, and what do they want?
- Rising action: What stands in the way? List two or three events, each harder than the last.
- Climax: What is the turning point? The strongest climaxes are a choice the character has to make, not just something that happens to them.
- Falling action: What happens because of that choice?
- Resolution: How has the character or their world changed?
The lesson, step by step
- Show the shape on a story they know (10 minutes). Map a short picture book or a class read-aloud on the diagram together. Ask: "Which event made things harder? Where is the turning point?"
- Map an original adventure (20 minutes). Students plan their own story on a blank diagram, one or two lines at each stop. Allow a quick sketch of the main character; it helps many students decide who the story is about.
- Test the rising action (10 minutes). Partners read each other’s rising-action events and ask: "Could these happen in any order?" If yes, the tension isn’t building. The writer reorders or changes an event so each one raises the stakes.
- Write or generate the story (second session, 25 minutes). Students write their story from the map, or use a story tool to draft it from their plan.
- Map check (15 minutes). Students draw a second, empty diagram and map the finished story onto it. Then they compare the two. Where did the story drift from the plan? Is the climax still a choice? Did the falling action disappear?
A worked example
This is an illustrative plan of the kind a sixth grader might make, not real student work.
| Stop | The plan |
|---|---|
| Exposition | Jun, a young mapmaker, wants to be the first to chart the Glass Caves. |
| Rising action 1 | Her lantern cracks on the way in, so she has half the light. |
| Rising action 2 | The cave splits into three tunnels, and her map shows none of them. |
| Rising action 3 | She hears someone else in the caves: a rival mapmaker. |
| Climax | The rival is trapped. Jun can help him and lose the race, or keep going. She stops. |
| Falling action | Together they find the way out using both their half-maps. |
| Resolution | The map of the Glass Caves is signed with two names. |
Notice that each rising-action event makes things harder than the last, and the climax is a choice. That is what to look for in students’ plans.
What the map check usually shows
When students compare their finished story to their plan, the same three problems come up again and again, whether they wrote it themselves or used a tool:
- The rising action is rushed. Three events become one paragraph.
- The climax becomes an event, not a choice. Something happens to the character instead of the character deciding.
- The falling action disappears. The story jumps from the climax straight to "and they lived happily ever after."
Each of these is a specific, fixable revision, which is much easier to act on than "add more detail." For more on revising, see how to revise your story after the first draft, and for younger writers the third-grade story map that shows the student’s thinking is a simpler starting point.
Where ArtifyTales fits
ArtifyTales can draft or illustrate from the student’s plan in step 4. A student can photograph their character sketch, which becomes a character with a name and personality, then type their plot diagram as a script to get illustrated, narrated story pages.
The map check is where this becomes a lesson rather than a shortcut. Generated stories often rush the rising action or skip the falling action, just as student drafts do. Students map the generated version, compare it with their own plan, and decide what to change. The plan stays theirs, and a teacher reviews every story before it is shared. For more on this, see how to keep student authorship visible in an AI-assisted story lesson.
Student work and privacy
Drawings, handwriting and recorded voices are student data. Read how ArtifyTales handles children’s drawings and voices and our FERPA and student data commitments before a class uploads anything, and get privacy, retention and deletion terms in writing before a school pilot.
Frequently asked questions
- What are the five parts of a plot diagram?
- Exposition introduces the character, setting and what they want. Rising action is the series of events and obstacles that build tension. The climax is the turning point, the moment of greatest tension. Falling action shows the consequences. The resolution shows how things have settled and how the character has changed.
- What is the difference between a plot diagram and a story map?
- A story map usually lists elements such as characters, setting, problem and solution. A plot diagram shows how tension rises and falls over time, which makes it better for planning pacing and for placing the climax. Younger students often start with a story map and move to a plot diagram around Grade 4.
- Is the climax always near the end?
- The climax is usually in the last third of a story, after the rising action has built the tension. It is followed by a short falling action and resolution. Students often place the climax too early, so the diagram helps them see how much rising action they need first.
- How many events should be in the rising action?
- Two or three events is enough for a short story, and each should make things harder or more tense than the one before. If the events could be swapped around without changing anything, the tension is not really rising.
- Can students use a plot diagram with an AI story tool?
- Yes, and it is a good use. Students plan the five stops themselves, use the tool to draft or illustrate, then check the result against their diagram. Generated stories often rush the rising action or skip the falling action, which gives students something concrete to revise.
- How do I assess a plot diagram?
- Look for a clear want in the exposition, rising action events that each raise the stakes, a climax that is a decision or turning point rather than just an event, and a resolution that shows change. Then check whether the finished story follows the diagram, and whether the student noticed where it did not.
Try the map check once
Even without any tools, having students map their finished story and compare it with their plan shows them exactly where to revise. See how ArtifyTales turns a child’s drawing into an animated story.
For classrooms and learning centers we build custom plans, including shared avatar pools and multi-student accounts. Request a school or institution pilot and tell us your grade and group size. The Kindergarten–Grade 8 Common Core ELA alignment sets out the literacy side.